Par Bernard Theot
Directeur Technique Métrologie
Supervision, Monitoring Vs Métrologie – Définition
Pour débuter le sujet, nous parcourrons la définition de trois termes souvent confondus.
Tout d’abord, abordons le « Monitoring ». Ce terme désigne le fait de « surveiller ». La Supervision est une de ses composantes, plutôt orientée temps réel. Le fait de « surveiller » quelque chose revient à connaître son état actuel mais aussi l’historique de ses états passés, par l’intermédiaire de valeurs et de données chiffrées. C’est ici que l’on retrouve la distinction entre les deux notions de Supervision et de Métrologie.
Dans le terme Métrologie, nous trouvons la racine « mètre/métrique ». C’est la discipline qui permet d’obtenir, de garder et de tracer la valeur numérique d’une charge. Les exemples sont nombreux, comme : le pourcentage de CPU utilisé sur un serveur, le nombre de personnes connectées sur un site Web, le trafic entrant et sortant d’un port de commutateur. Bien souvent, la Métrologie permet tout simplement de tracer des graphiques, bien connus dans le domaine du Monitoring.

Le domaine de la métrologie
Pour adresser la complexité toujours grandissante des écosystèmes applicatifs, la Métrologie est un domaine en perpétuelle évolution. Elle est à même de répondre à une large variété de publics, comme les ingénieurs réseaux, les développeurs, les testeurs ainsi que les différents métiers de l’entreprise.
Afin d’adresser ces différents types de publics et de couvrir l’ensemble des composantes de l’écosystème IT, la Métrologie est organisée en trois dimensions interdépendantes : L’Utilisateur, l’Application et le Réseau. Différentes technologies permettent d’instrumenter ces dimensions. Chacune de ces technologies est spécialisée dans le domaine qu’elle couvre. Une corrélation est ensuite mise en place afin de présenter la somme des résultats de la Métrologie au sein d’un portail de visualisation unifié.
Nous allons maintenant parcourir chacune des dimensions de la Métrologie.
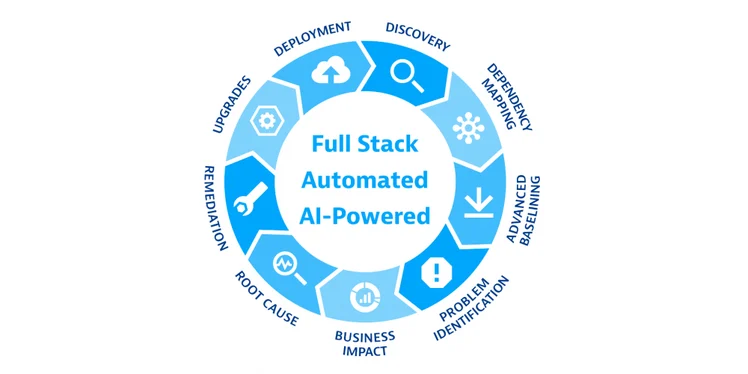
L’utilisateur IT – User Centric
 L’UEM ne monitore pas seulement les ressources avec lesquelles l’employé interagit, mais permet également de procéder pro activement à des remédiations automatisées afin d’améliorer en permanence l’expérience des utilisateurs.
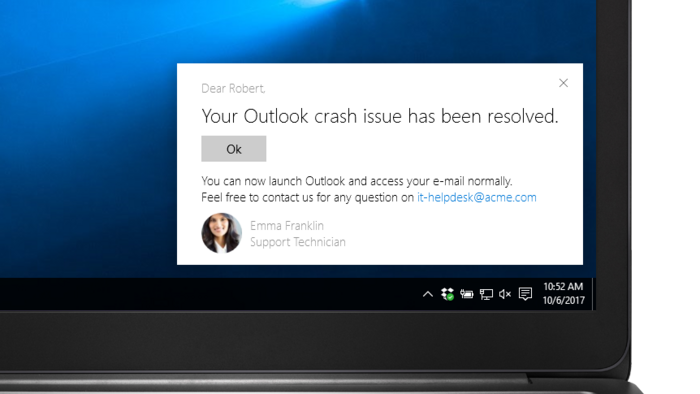
L’application - Application Centric
La dimension Application est adressée par la technologie APM (Application Performance Management). Cette technologie permet aux équipes IT d’assurer une disponibilité consistante et un niveau de performance élevé pour les applications de l’entreprise. Les sites Web, les applications mobiles et business sont autant de candidats pour le monitoring. Dans le monde digital actuel, hautement connecté, le monitoring s’étend aux services, aux process, aux hosts, aux logs, aux réseaux et bien évidemment, aux utilisateurs finaux ; aussi bien clients externes, que partenaires ou employés.
Tous les jours, l’utilisateur accède à des applications pour acheter en ligne, regarder des émissions télévisées, se connecter à ses réseaux sociaux, gérer ses finances et travailler. L’utilisateur est frustré lorsqu’il subit des crashes applicatifs ou lorsque l’application répond lentement.
Les variables qui peuvent impacter les performances de l’application sont nombreuses : erreurs de code ou bugs logiciels, ralentissements de bases de données, dégradations des performances réseaux ou hosts, types de supports et systèmes d’exploitation, etc.
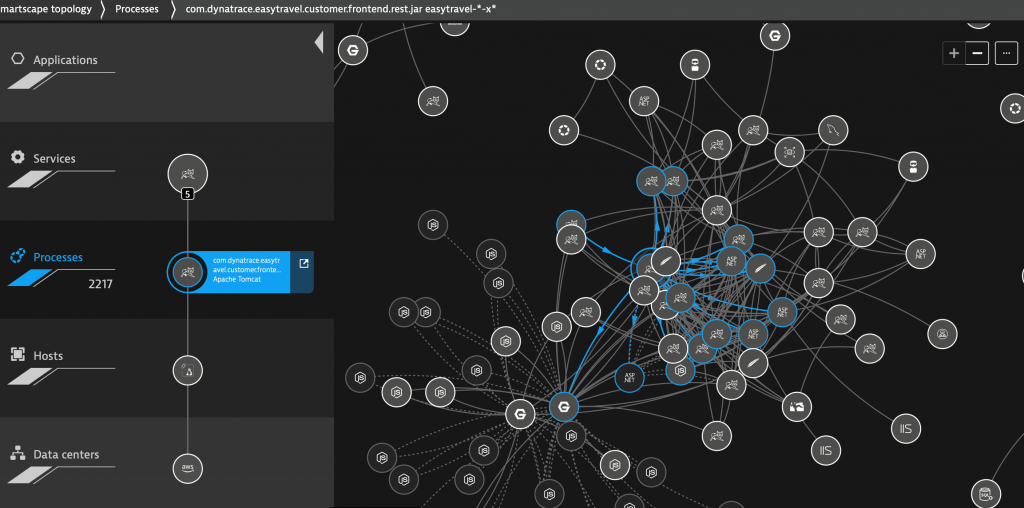
Les sites Web ainsi que les applications mobiles et métiers sont de plus en plus complexes ; bâtis sur des millions de lignes de code, des centaines de services digitaux interconnectés et hébergés dans de multiples services Cloud. C’est pour ces raisons que les équipes digitales utilisent des solutions APM qui leur permettent de comprendre et de dépanner les différents composants qui peuvent impacter les performances.
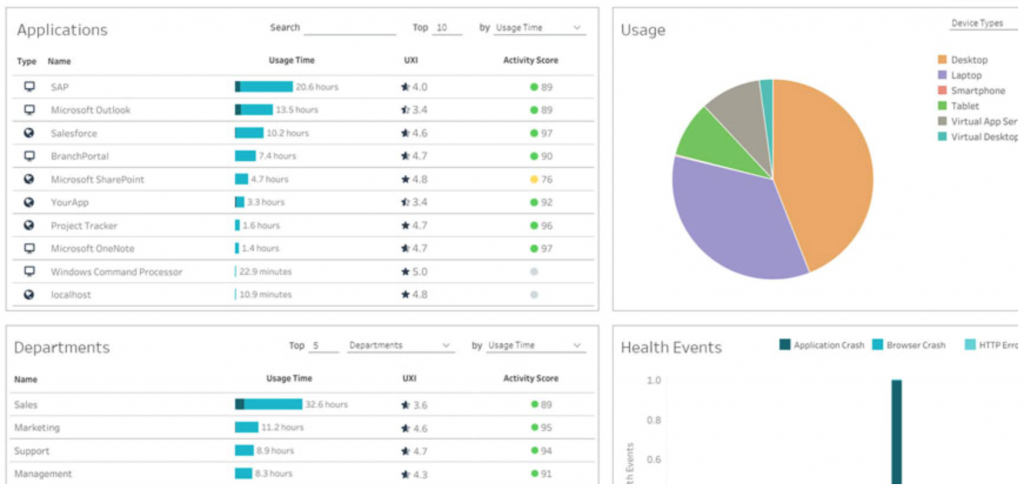
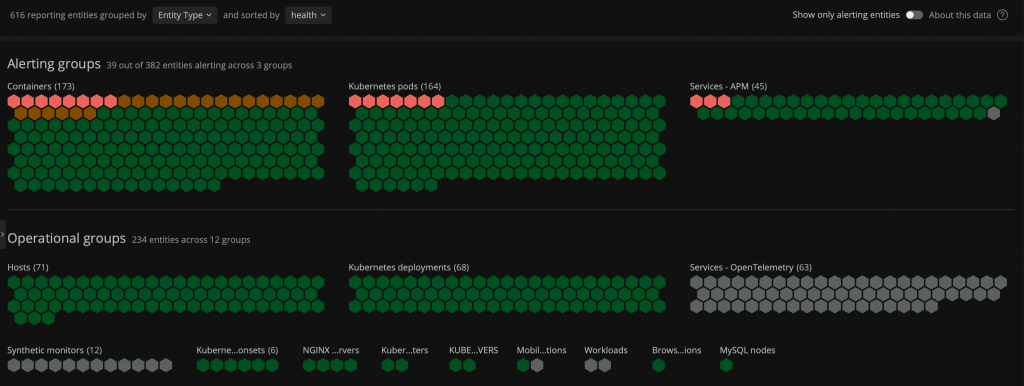
Exemple d’interactions applicatives relevées par une solution APM
Suivi de l’état, en temps réel, de plusieurs centaines de services applicatifs.
Le Réseau - Network Centric
La dimension réseau est adressée par la technologie NPM (Network Performance Monitoring). Cette technologie est un ensemble de méthodes qui permettent de contrôler et d’assurer les meilleurs niveaux de performances d’un réseau. Les métriques de performances clés généralement collectées par les sondes NPM sont : Les taux d’erreurs, les délais, les pertes de paquets, les retransmissions et l’utilisation des bandes passantes.
Les solutions NPM permettent une approche pro active pour identifier et réduire les goulets d’étranglement et autres incidents réseaux. Ces problèmes affectent non seulement les utilisateurs finaux, mais également les opérations métiers dans leur ensemble, y compris les tâches de maintenance de base.
Eu égard à leur complexité croissante, les infrastructures IT actuelles exigent des informations pertinentes sur la visibilité de bout en bout. De nos jours, les cellules réseaux déploient un nombre conséquent de composants pour améliorer la productivité, augmenter les performances réseaux et garantir la meilleure expérience utilisateurs.
Le maintien de ce niveau de visibilité est un réel challenge face à l’empilage des technologies, aussi bien dans les environnements tierces parties, hébergeant les applications en mode SaaS, que face à l’augmentation de la densité des applications internes.
Le NPM identifie les incidents relatifs aux fonctions internes en évaluant les mesures de performance de chaque composant de l’infrastructure réseau. La surveillance en temps réel des métriques de performance ou des journaux permet aux équipes IT de résoudre les incidents de manière pro active en identifiant les causes potentielles des pannes avant qu’elles n’impactent la production.
Les menaces de sécurité telles que les logiciels malveillants (Malwares) sont souvent à l’origine de mauvaises performances du réseau et peuvent rapidement entraîner un désastre pour l’entreprise. Une solution NPM doit être capable de détecter les périphériques réseaux non sécurisés, les logiciels malveillants et autres vulnérabilités réseau. Cela permet aux services IT de développer des protocoles de gestion des défaillances et des performances du réseau pour gérer et prévenir les faiblesses avant que les données confidentielles ou les utilisateurs finaux soient affectés.
Évaluation du niveau de maturité
Afin de permettre à l’entreprise de se positionner et de contrôler sa progression en matière de Métrologie, le Gartner a créé une échelle de maturité. Suivant les process déjà établis, l’IT peut situer son degré de maturité actuel avant d’immiscer sa progression vers le palier suivant, par l’adoption des process liés. Sans être tenu d’atteindre le niveau maximum de valeur, l’IT a le choix de planifier sa progression jusqu’au niveau souhaité.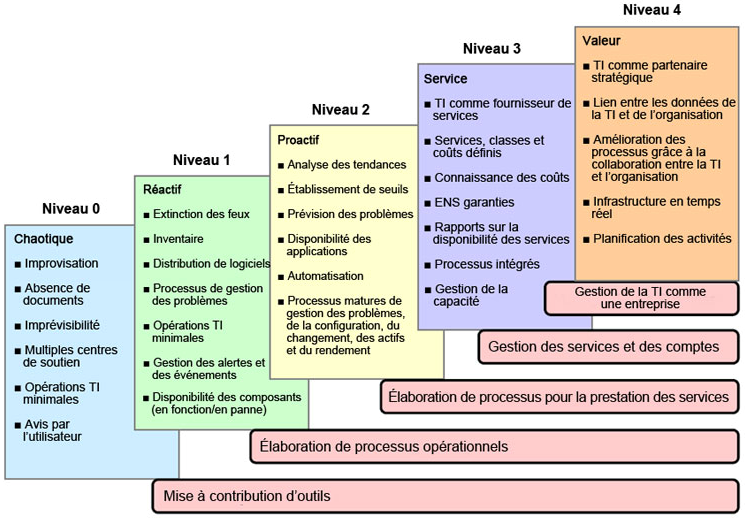
Évolutions actuelles de la Métrologie
Suite à l’adoption de plus en plus importante de la Métrologie par les différents acteurs de l’entreprise, de nombreuses évolutions ont débuté. Certaines d’entre elles sont déjà très élaborées. Nous proposerons prochainement d’autres articles qui nous permettront de détailler les plus pertinentes.
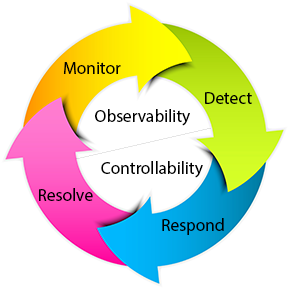
Un des domaines des plus intéressants est celui de L’Observabilité. En se nourrissant de métriques et données recueillies, pour une grande part via la Métrologie, l’Observabilité va bien plus loin que les simples constats d’erreurs mais recherche vraiment les causes des dysfonctionnements. L’Observabilité aide les équipes modernes à :
- Livrer des logiciels de qualité supérieure, à grande échelle.
- Développer une culture de l’innovation durable.
- Optimiser les investissements en cloud et outils modernes.
- Voir les performances de leur activité numérique en temps réel.
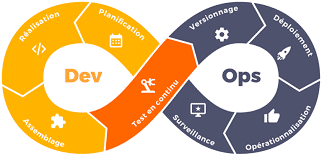
Un second domaine important est le DevOps. Cette discipline combine le Développement (Dev) et les Opérations (Ops) afin de réunir les personnes, les processus et les technologies destinés à fournir continuellement de la valeur aux clients.
DevOps permet la coordination et la collaboration des rôles autrefois cloisonnés pour créer des produits plus performants et plus fiables.
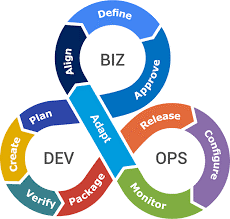
Après plusieurs années de pratique DevOps, le business a senti un fort intérêt à s’intégrer aux différentes pratiques. Dans cette évolution, a été créé le BizDevOps. Tout comme le DevOps qui contourne les silos qui séparent le développement des opérations, le BizDevOps contourne les silos qui séparent le DevOps du reste de l’entreprise. Pour accomplir le BizDevOps, il faut favoriser la collaboration entre l’équipe commerciale et les responsables produits, les développeurs et les opérateurs pour établir les priorités en cas de sprints ou de backlogs. Il est important d’encourager cette collaboration à travers tout le cycle de publication.
Et pour finir, une autre discipline que nous détaillerons dans un prochain article est la Remédiation, sous nom de code NoOps. Cette pratique consiste en l’automatisation intégrale de la gestion de l’IT, souvent basée sur l’Intelligence Artificielle. Il s’agit ici de gérer l’infrastructure et le déploiement d’applications tout en éliminant le besoin d’intervention humaine.